Prometheus, Grafana and Loki: What to Alert On First
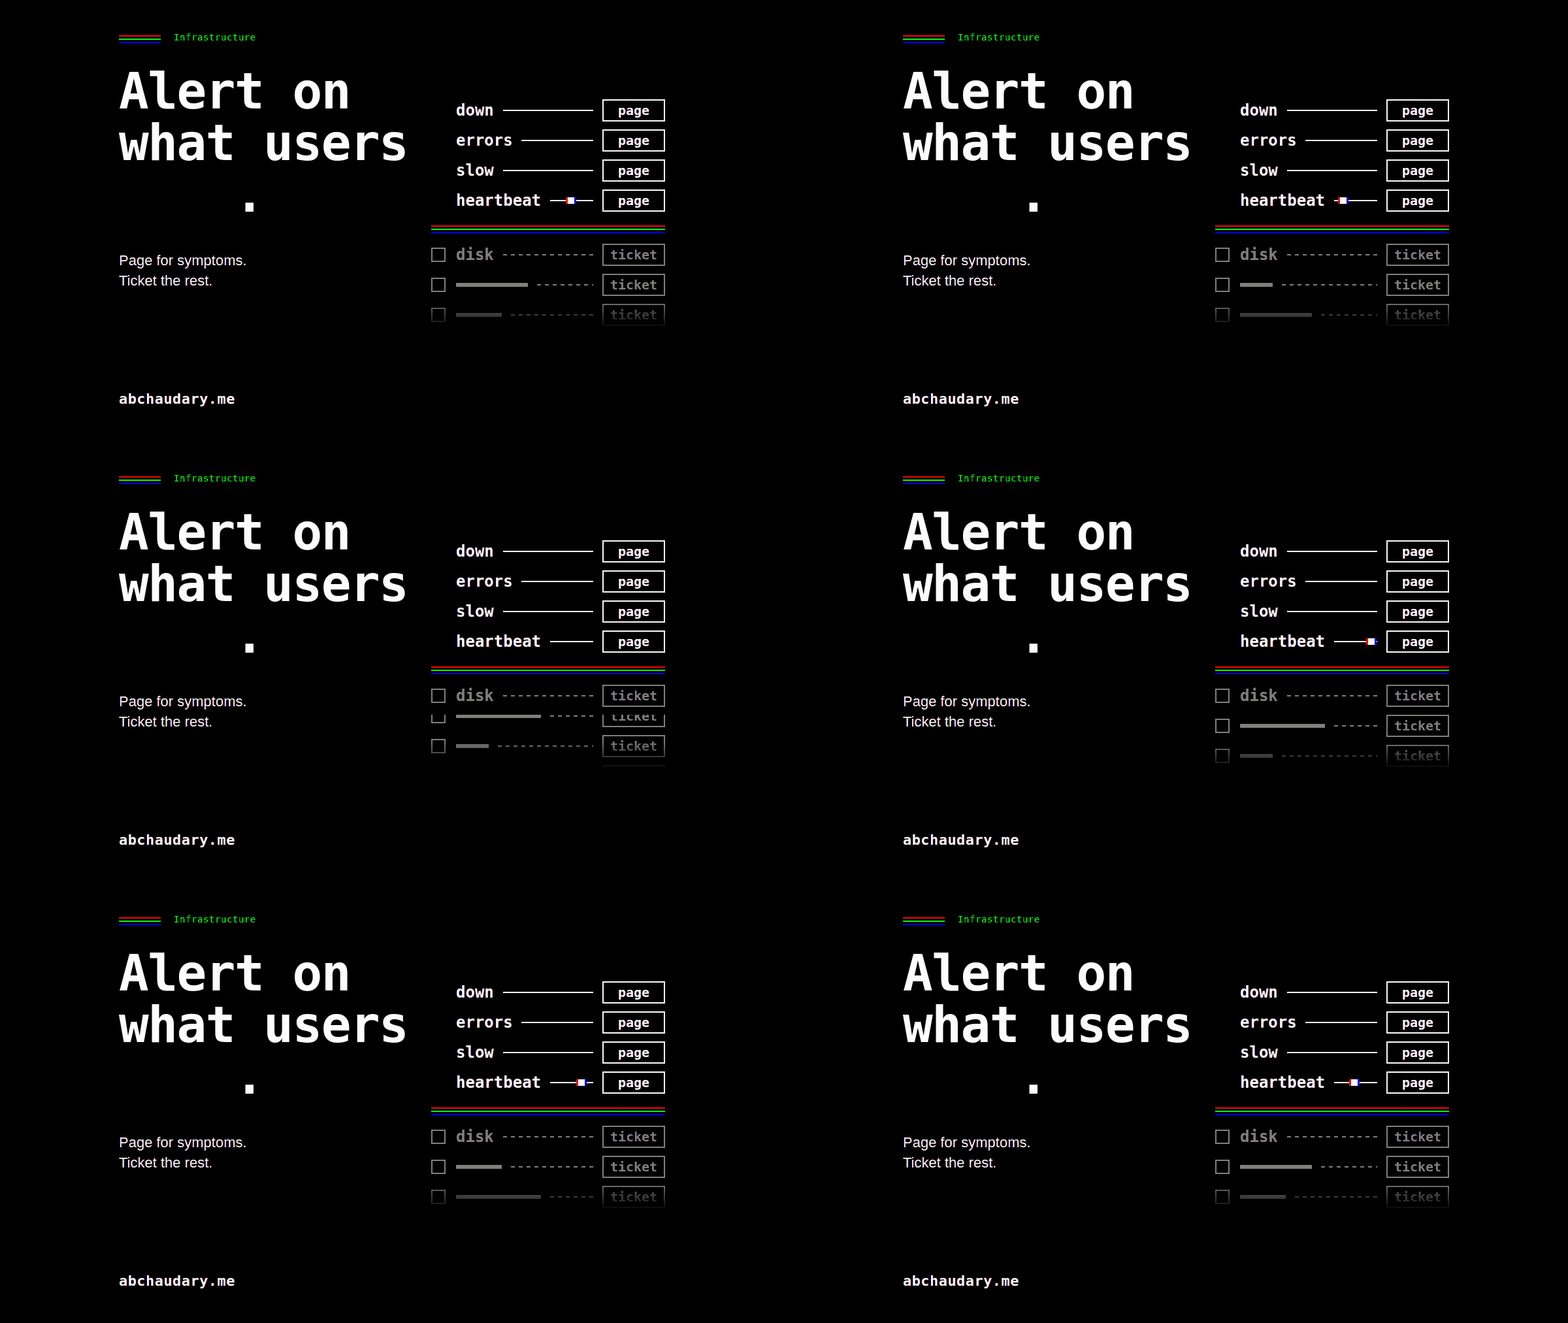
What a small team should alert on first with Prometheus, Grafana and Loki: page-or-ticket alerts and a heartbeat, timed in a lab where one log alert failed silently.
For six minutes on 21 October 2026, my Loki error alert reported healthy every minute while a test app logged an error on 30% of its requests. The ruler evaluated on schedule, returned zero rows, and stayed quiet. Loki had rejected every log push since start-up with Ingester is shutting down, because the lab host's disk was at 94% and Loki stops writing above 90% by default. Nothing paged, because a log alert with no input looks exactly like a healthy one.
That run was part of a lab I built to test Prometheus, Grafana and Loki alerting for a small team: which alerts to write first, and which to leave alone. I run Prometheus and Grafana on client servers, some on-premises and some on dedicated hosts, and Loki in production for a client project.
TL;DR: Use symptom-based alerting: page on what users feel: the service is down from outside, requests are failing, requests are slow. Add a heartbeat that proves the alert path works, and a check that the metrics still arrive. Send causes (disk trends, missing metrics) to a ticket queue, not a pager. Guard error ratios with a traffic floor, use for: on every rule, and let Alertmanager inhibit the symptoms of an outage you already paged for. In my lab the first page arrived 100 to 185 seconds after each fault, every second of it explained by configuration.
What Should a Small Team Alert On First?
A small team should alert first on symptoms users feel, at the edge of the system, and on the alert path itself. Google's SRE book names four golden signals, "latency, traffic, errors, and saturation", and the Prometheus documentation says to "aim to have as few alerts as possible, by alerting on symptoms that are associated with end-user pain".
My first set, in the order I would add them:
- Watchdog: an alert that always fires, so a silent receiver means the alert path is broken.
- EndpointDown: a black-box probe from outside the app fails. Page.
- HighErrorRatio: more than a set share of user requests fail, above a traffic floor. Page.
- LatencyP95High: the 95th percentile of request time crosses the target, above the same floor. Page.
- DiskWillFillIn24h: the filesystem trend reaches zero within a day. Ticket.
Plus AppMetricsMissing, an absent() check that the app's metrics still exist, as a ticket. Without it, every rule built on those metrics goes quiet when the metrics disappear.
Nothing on that list watches CPU, memory or a single container. Those are causes. They belong on a Grafana dashboard you open after a page tells you something is wrong.
How Do You Decide Between a Page and a Ticket?
Page when a human must act now because users are affected or about to be; ticket everything else that needs action this week. Rob Ewaschuk's rule, which became the basis of the SRE book's monitoring chapter: "Pages should be urgent, important, actionable, and real."
In the rule sets I write for clients, every alert carries three things before it is merged:
- A severity label,
pageorticket, which Alertmanager routes on. - A
for:duration, so a single bad scrape cannot page anyone. - A runbook link, so the person woken up knows the first command to run.
The 2026 Grafana Labs Observability Survey, based on 1,363 responses, found alert fatigue was the most cited obstacle to faster incident response, named by 30% of respondents. Alert fatigue starts with pages that are not urgent, important, actionable and real.
What Do the First Five Alerts Look Like in Prometheus?
The rules below are from the lab, trimmed to the expressions. Each one also carries summary and runbook_url annotations. The thresholds are lab values, not recommendations for your service.
- alert: EndpointDown
  expr: probe_success{job="blackbox"} == 0
  for: 1m
  labels: {severity: page}

- alert: HighErrorRatio
  expr: |
    (
      sum by (service) (rate(http_requests_total{job="app", status=~"5.."}[2m]))
        /
      sum by (service) (rate(http_requests_total{job="app"}[2m]))
    ) > 0.05
    and
    sum by (service) (rate(http_requests_total{job="app"}[2m])) > 0.5
  for: 2m
  labels: {severity: page}

- alert: LatencyP95High
  expr: |
    histogram_quantile(0.95,
      sum by (service, le) (rate(http_request_duration_seconds_bucket{job="app"}[2m]))
    ) > 0.5
    and
    sum by (service) (rate(http_request_duration_seconds_count{job="app"}[2m])) > 0.5
  for: 2m
  labels: {severity: page}

- alert: DiskWillFillIn24h
  expr: predict_linear(node_filesystem_avail_bytes{fstype!~"tmpfs|overlay|squashfs|nsfs"}[6h], 24 * 3600) < 0
  for: 1h
  labels: {severity: ticket}

- alert: Watchdog
  expr: vector(1)
  labels: {severity: none}

- alert: AppMetricsMissing
  expr: absent(http_requests_total{job="app", service="demo-app"})
  for: 1m
  labels: {severity: ticket}
The lab ran Prometheus v3.15.1, Alertmanager v0.34.1, Grafana 13.2.4, Loki 3.7.9, Grafana Alloy v1.21.0, node_exporter v1.12.1 and blackbox_exporter v0.29.0 in Docker Compose, with a small Python app serving about 5 requests per second. Scrape and rule evaluation ran every 15 seconds.
How Fast Do These Alerts Actually Page?
Each alert that paged reached the webhook receiver between 100 and 185 seconds after I caused its fault, and every second came from configuration: the time to cross the threshold, the for: duration, and Alertmanager's group_wait. Nothing was slow by accident. I caused each fault, read the times from Prometheus, Alertmanager and the receiver's log, and subtracted.
- EndpointDown, 100.4 s: 10 s to the first failed probe, plus
for: 1m, plus Alertmanager's 30 sgroup_wait. - LatencyP95High, 161.3 s: 11 s to pending, plus
for: 2m, plus 30 s. - HighErrorRatio, 185.4 s: 35 s for the 2-minute rate window to cross 5%, plus
for: 2m, plus 30 s. - AppErrorLogBurst (Loki), 130.6 s: 40 s to the next 1-minute ruler evaluation, plus
for: 1m, plus 30 s.
The lab windows are short so a run fits in half an hour. With for: 5m and longer rate windows, the same sum gives a page in roughly six minutes. That is the trade a small team makes on purpose: a few minutes of delay in exchange for not being woken by a blip.
One result belongs in every runbook. In a second error burst, the page arrived 51 seconds after I had already fixed the fault, because the 2-minute window still held the errors. A page can describe a problem that has ended, so the runbook's first step is to check whether the symptom is still there.
How Do You Stop a Quiet Service Paging on One Error?
Add a traffic floor to every ratio alert, so the ratio only counts when there are enough requests to mean something. The SRE Workbook gives the arithmetic: at 10 requests an hour, "a single failed request results in an hourly error rate of 10%", which against a 99.9% target "would page immediately".
The and sum(rate(...)) > 0.5 clause in HighErrorRatio is that floor. I tested it with promtool test rules:
- With the floor: 2 requests a minute, one failing each minute for 4 minutes, a 50% error ratio. No alert. All 7 test groups passed.
- Without the floor: the same input fires
HighErrorRatioat 4m30s and 5m, and the test fails.
A single failed request stayed silent with or without the floor, because one error leaves a 2-minute window before for: 2m is met. The floor matters when failures repeat on a quiet service.
The floor has a cost. Below it, a quiet service can fail every request and this alert will not page. EndpointDown covers the total outage; a slower, longer-window error alert sent as a ticket covers the rest.
How Do Grouping and Inhibition Keep an Outage to One Page?
Alertmanager's inhibit rules suppress symptom alerts while the alert that explains them is firing, and grouping folds related alerts into one notification. In the lab, when the app answered 503 to everything, two page-level alerts were true at once. One page arrived.
route:
  receiver: ticket
  group_by: [alertname, service]
  group_wait: 30s
  group_interval: 5m
  repeat_interval: 4h
  routes:
    - matchers: ['alertname="Watchdog"']
      receiver: heartbeat
      group_wait: 0s
      group_interval: 1m
      repeat_interval: 1m
    - matchers: ['severity="page"']
      receiver: page
    - matchers: ['severity="ticket"']
      receiver: ticket
      repeat_interval: 24h

inhibit_rules:
  - source_matchers: ['alertname="EndpointDown"']
    target_matchers: ['alertname=~"HighErrorRatio|LatencyP95High|AppMetricsMissing"']
    equal: [service]
EndpointDown paged at 17:18:36 UTC. HighErrorRatio fired in Prometheus at 17:19:21, and Alertmanager held it as suppressed. When I stopped the container, AppMetricsMissing fired and was suppressed the same way.
The order of the for: durations is what makes this work. EndpointDown waits 1 minute and the error ratio waits 2, so the source alert is already firing when the target arrives. Reverse them and the error ratio pages first, and the inhibit comes too late.
Two behaviours surprised me:
- A repeat outage sent no second page. The endpoint failed again 3 minutes after the first outage resolved, and the receiver got nothing. The resolve had not been sent yet, so at the next 5-minute
group_intervaltick the same alert was still firing, and Alertmanager appears to have treated it as the incident it had already paged for. On-call learns about a flapping endpoint from the first page only. - The heartbeat came every 2 minutes, not every 1. The Watchdog route set
repeat_interval: 1m; the receiver logged 14 heartbeats, 2 minutes apart. Repeats appear to go out only on agroup_intervalflush. Size the dead man's switch timeout on the receiving side from the cadence you measure, not the one you configure.
Where Does Loki Fit, and How Does It Fail Silently?
Loki fits as the place you go after a page, and as a source of a few log-based tickets for lines that should never appear. In the lab I provisioned a Grafana data link from the 5xx ratio panel to the matching Loki error lines in Explore, which connects metrics and logs without a tracing system.
Three settings decide whether Loki helps or hides problems:
- Disk headroom. Loki's ingester stops accepting writes when its WAL disk passes
disk_full_threshold, 0.9 by default. The error,Ingester is shutting down, does not mention the disk. Grafana Alloy loggeddropping data, and the ruler kept reporting healthok. After I raised the threshold to 0.99 (lab only; on a real host, free the disk), Loki held 295 lines in the next minute and the log alert fired 130.6 seconds after the next burst began. - Retention is off by default. Loki's documentation says that by default "the logs sent to Loki live forever". Retention needs
compactor.retention_enabled: trueand aretention_period; the lab set one week, and Loki's/configconfirmedretention_period: 1w. - Labels. Keep them few and bounded. The lab stored only
compose_service,containerandservice_name, and parsedlevelat query time with| json. Loki's own guidance is "don't add a level dynamic label".
The query that confirmed the burst:
{container="b17lab-app-1"} | json | level="error"
sum(count_over_time({container="b17lab-app-1"} | json | level="error" [132s]))  =>  396
Is Promtail deprecated? Yes. Loki's documentation says "Promtail is end of life (EOL) as of March 2, 2026"; Grafana Alloy replaces it, and the lab used Alloy. If your logs still ship through Promtail, plan the move.
The disk lesson is the one I would take back to production. Pair every log alert with a check that logs are arriving, the same way the Watchdog proves the alert path, and alert on Loki's own disk before the application's.
Which Alerts Should Never Page?
Never page on a cause you could catch as a symptom, on a single host or container, or on a rule that cannot become true. The SRE book's chapter on practical alerting calls alerts on single-machine failures "too noisy to be actionable".
What I keep off the pager:
- CPU and memory thresholds. High CPU with fast, correct responses is a busy server, not an incident. If it hurts users,
LatencyP95Highfires. - One container restarting. Docker or the orchestrator restarts it; a restart loop shows up as errors or a missing endpoint.
- Disk trends. They are real, but they have hours of lead time.
DiskWillFillIn24his a ticket, and itsfor: 1hearned its place in the lab: with a few minutes of data on a 94% disk,predict_linearpredicted the disk would fill within a day 35 seconds after Prometheus started. It stayed pending, and within half an hour the prediction had recovered. - Rules that cannot fire correctly yet. In a client rule set I kept a file of alerts unloaded, because their input pipeline did not exist yet and one rule would have fired permanently. An alert that is always red teaches people to ignore red.
The SRE book adds a review rule that suits a small team: alert configuration "rarely exercised (e.g., less than once a quarter for some SRE teams) should be up for removal."
How Do You Test Alert Rules Before They Ship?
Test them like code: promtool check rules for syntax, promtool test rules for behaviour, amtool check-config for routing, all in CI. In the lab, promtool check rules reported SUCCESS: 6 rules found, the 7 test groups passed, and amtool reported 1 inhibit rule and 3 receivers.
The convention I use in client repositories is one test case where each alert fires and one where it must not. The "must not" cases are the ones that catch noise: the low-traffic guard, a 2% error ratio under a 5% threshold, a probe blip shorter than for:. I also add a lint step that fails the build when a rule queries a metric the application does not register, so a renamed metric breaks CI instead of silently disabling the alert.
Which Versions Should You Run in October 2026?
As of 21 October 2026, the current releases are Prometheus 3.15.1, Alertmanager 0.34.1, Grafana 13.2.4, Loki 3.7.9 and Grafana Alloy 1.21.0. For a small team I would run the Prometheus 3.13 long-term support line, which the Prometheus project supports until 31 July 2027, so upgrades happen on your schedule.
For where these services sit on a single server, see how this site runs on one VPS. For the hardware exporters this stack needs once you leave a cloud provider, see the monitoring section of what moving off AWS to self-hosted servers cost.
Limitations: What Does This Lab Not Show?
- Short windows.
for:of 1 to 2 minutes and 2-minute rate windows. The order of events and the inhibition timing carry over to production; the absolute seconds do not. - One host, one app, synthetic traffic. The thresholds (5% errors, 0.5 requests per second, 500 ms p95, more than 10 error lines a minute) are lab values.
- Latency is an estimate. The app slept 0.72 to 0.88 seconds per request and Prometheus reported p95 = 0.975 s, because
histogram_quantileinterpolates between the 0.5 and 1.0 buckets. Put a bucket boundary at your latency target. - Interpretation, not confirmation. The repeat-outage and heartbeat-cadence explanations are my reading of Alertmanager's logs and timing, not something I verified in its source.
- Client details. The patterns from client rule sets are described without names, counts or thresholds.
What is the noisiest alert you have deleted, and what did you replace it with?
More in Infrastructure field notes.
References
- Google, Site Reliability Engineering, chapter 6: Monitoring Distributed Systems, read 21 October 2026.
- Google, Site Reliability Engineering, chapter 10: Practical Alerting, read 21 October 2026.
- Google, The Site Reliability Workbook, chapter 5: Alerting on SLOs, read 21 October 2026.
- Rob Ewaschuk, My Philosophy on Alerting, read 21 October 2026.
- Prometheus, Alerting best practices and release cycle and LTS, read 21 October 2026.
- Prometheus, Alertmanager and Alertmanager configuration, read 21 October 2026.
- Grafana Labs, Loki label best practices, Loki retention and Promtail and configuration reference, read 21 October 2026.
- Grafana Labs, Observability Survey 2026, read 21 October 2026.
- GitHub releases for Prometheus, Alertmanager, Grafana, Loki and Alloy, checked 21 October 2026.